Forecasting
We study a number of methods to produce and improve renewable power forecasts at
many time scales. Below are descriptions of some of the methods we use.
More information on these topics can be found in our
presentations
and papers.
WRF
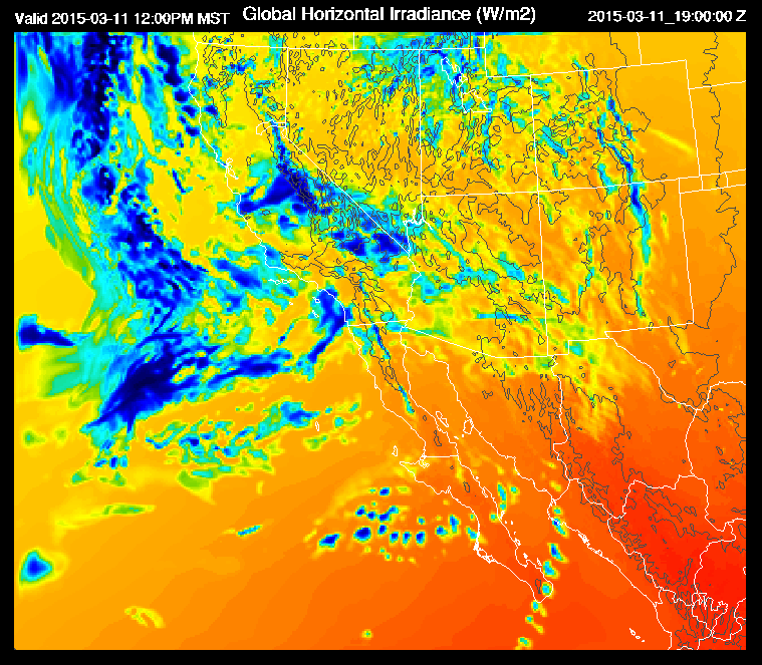
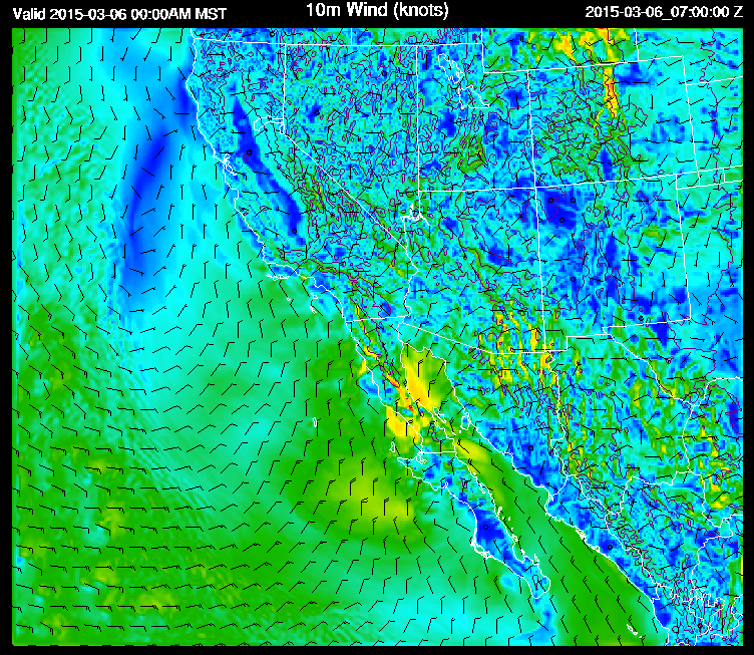
The University of Arizona Department of Hydrology & Atmospheric Sciences
runs the Weather Research and Forecasting (WRF)
model with a configuration customized for the Southwest
United States. The model runs in a nested configuration with a 5.4 km outer
domain grid spacing that covers the Western US and a 1.8 km inner domain that
covers Arizona and New Mexico. An ensemble of runs are produced each day based
on different initialization models and times. These forecasts are best suited for forecasting events 6 hours to 8 days in the future.
Graphics from the most recent WRF runs can be found
here.
Satellite-derived Irradiance Forecasts
For one hour to four hour forecast horizons, we’re invesitgating irradiance estimates and forecasts derived from geostationary satellite images. By using a physical model that determines the cloud properties from the visible and infrared images from the GOES-W satellite, we then use these cloud properties to estimate the irradiance to produce a forecast.
Sensor Network Forecasts
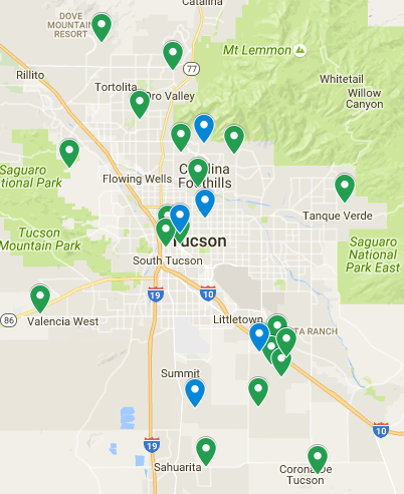
Using a network of irradiance sensors and rooftop PV power data that acts as a proxy for irradiance, we produce short-term, irradiance forecasts for the Tucson area. We've shown that these forecasts have skill over persistence forecasts in the one minute to thirty minute forecast horizon zone.
Related Publications
Lorenzo et. al. Solar Energy 122 1158-1169, Irradiance Forecasts based on an Irradiance Monitoring Network, Cloud Motion, and Spatial Averaging (2015). journal link
Lonij et. al. Solar Energy 97 58-66, Intra-hour forecasts of solar power production using measurements from a network of irradiance sensors (2013).
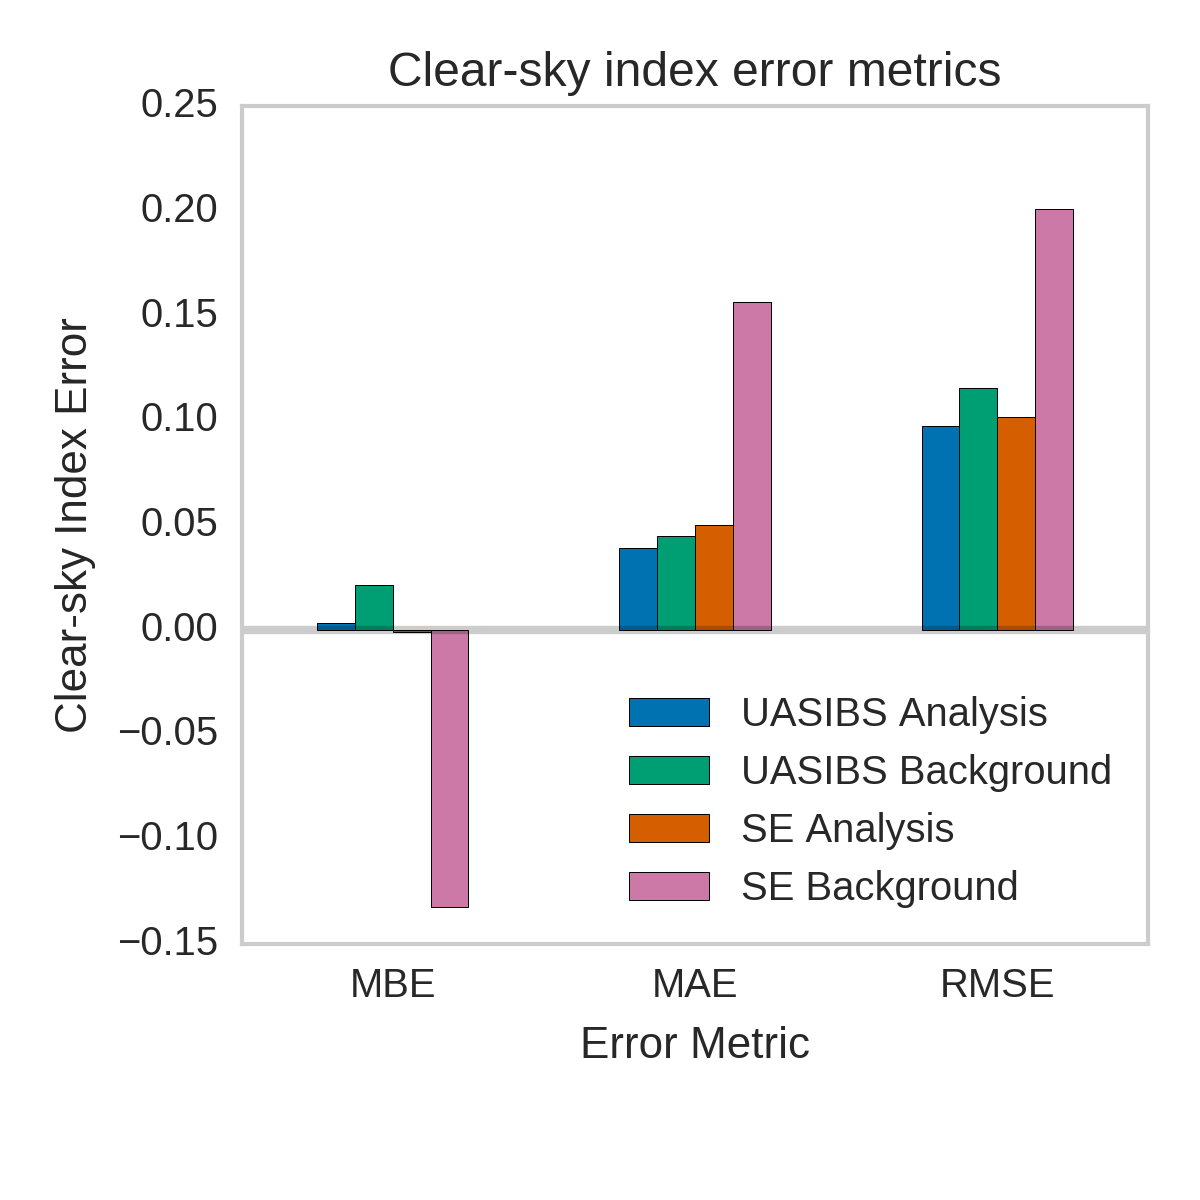
Satellite Irradiance Optimal Interpolation
We've also used the network of sensors in Tucson to improve satellite derived irradiance estimates via a method know as optimal interpolation. This method eliminates bias in the estimates and reduces the root mean squared error of the estimates by 50%.
Related Publication
Lorenzo et. al. Solar Energy 144 466-474, Optimal Interpolation of Satellite and Ground Data for Irradiance Nowcasting at City Scales (2017). journal link poster